Abstract
Turbo Fashion Index began as a fashion project and gradually became an experiment in whether alternative data could help explain or predict the performance of public companies. My earliest models focused on online search activity, based on the idea that growing attention around consumer brands might translate into stronger demand and eventually stronger financial performance. Some early backtests appeared extremely promising, but those results became unstable as I changed assumptions, expanded the tests, and compared the strategies against stronger benchmarks.
I eventually narrowed the project from predicting stock prices to estimating quarterly revenue. Search data still failed to add consistent forecasting value, which led me toward company-specific operating key performance indicators (KPIs), management guidance, and Wall Street expectations. Retrospective KPI tests showed strong relationships between operating metrics and revenue, but those tests benefited from hindsight and, in some cases, from relationships that were partly mechanical. More realistic pre-earnings tests were substantially weaker. Later strict comparisons found Quarter Winner closer than Street on raw forecast error in only one of five completed company tests, and even that result failed against a simpler benchmark.
The project did not establish a repeatable forecasting edge. Instead, it evolved into Quarter Winner, a research framework designed to translate headline revenue expectations into the operating performance those expectations imply. More importantly for me, the project became an education in benchmarking, overfitting, data quality, research design, and how easily the ability to build something can get ahead of the ability to know whether it actually works.
1. From Fashion to a Research Question
In middle school, I fell in love with experimenting with outfits and using clothing as a way to express my character to other people. Over time, that hobby grew into a genuine interest in fashion and the industry behind it. I began researching brands, learning their histories, and trying to understand why certain companies or styles became popular while others disappeared.
There were also a few problems I constantly ran into as someone interested in clothing. I struggled to find the exact piece I had in mind for an outfit, I would miss sales, and I had trouble discovering new brands that actually fit my style. That led me to build the original version of Turbo Fashion Index. With the help of AI-assisted development tools, I made a site that scraped product information from dozens of Shopify stores. It collected information such as materials, sizes, prices, and colors, then tried to break down a user’s search into clothing that fit what they were looking for while also showing new brands and deals.
The idea was interesting, but the actual product became messy quickly. The scrapers required constant maintenance, the database was difficult to manage, and I did not believe the product quality or likely user retention justified continuing to develop it. Eventually I stopped working on that version.
I still wanted to build something. Seeing how far I had gotten gave me confidence that I could use those same skills for a different project. Business and economics had interested me for a long time, and combining them with something I already understood—fashion—felt like a good way to learn by actually doing.
Through social media and my own interest in fashion, one observation kept standing out to me: hype matters. New trends, collaborations, products, and cultural moments can bring enormous attention to a brand. My first question was whether that attention could be measured and whether it had any relationship to financial performance.
There were several possible measures of hype, including social-media activity and app downloads, but search activity was accessible and broad. If somebody suddenly became interested in a brand, one of the most basic things they might do was search for it.
At the time, my understanding of the stock market was still simple. I understood that people owned shares in companies and that successful companies could become more valuable, but I understood little about expectations, valuation, risk, or how many different factors affect stock prices. My logic was basically that if hype created demand, demand helped a business, and a stronger business could eventually become more valuable, maybe search activity contained useful information.
I still think the question was worth asking. What was naïve was assuming each step was simple. Search interest can come from negative attention. Attention does not automatically become purchases. Higher sales do not necessarily create higher profits. And even if a company performs well, its stock can still fall if investors expected even more.
That was the question behind the finance-focused version of Turbo Fashion Index.
2. Turbo Fashion Index: Turning Attention Into a Signal
The first finance-focused version of Turbo Fashion Index compared Google Trends search interest for fashion brands with the stock prices of the public companies behind them. I also experimented with broader trends related to those brands—for example, whether companies associated with a particular style performed differently while that style was becoming more popular.
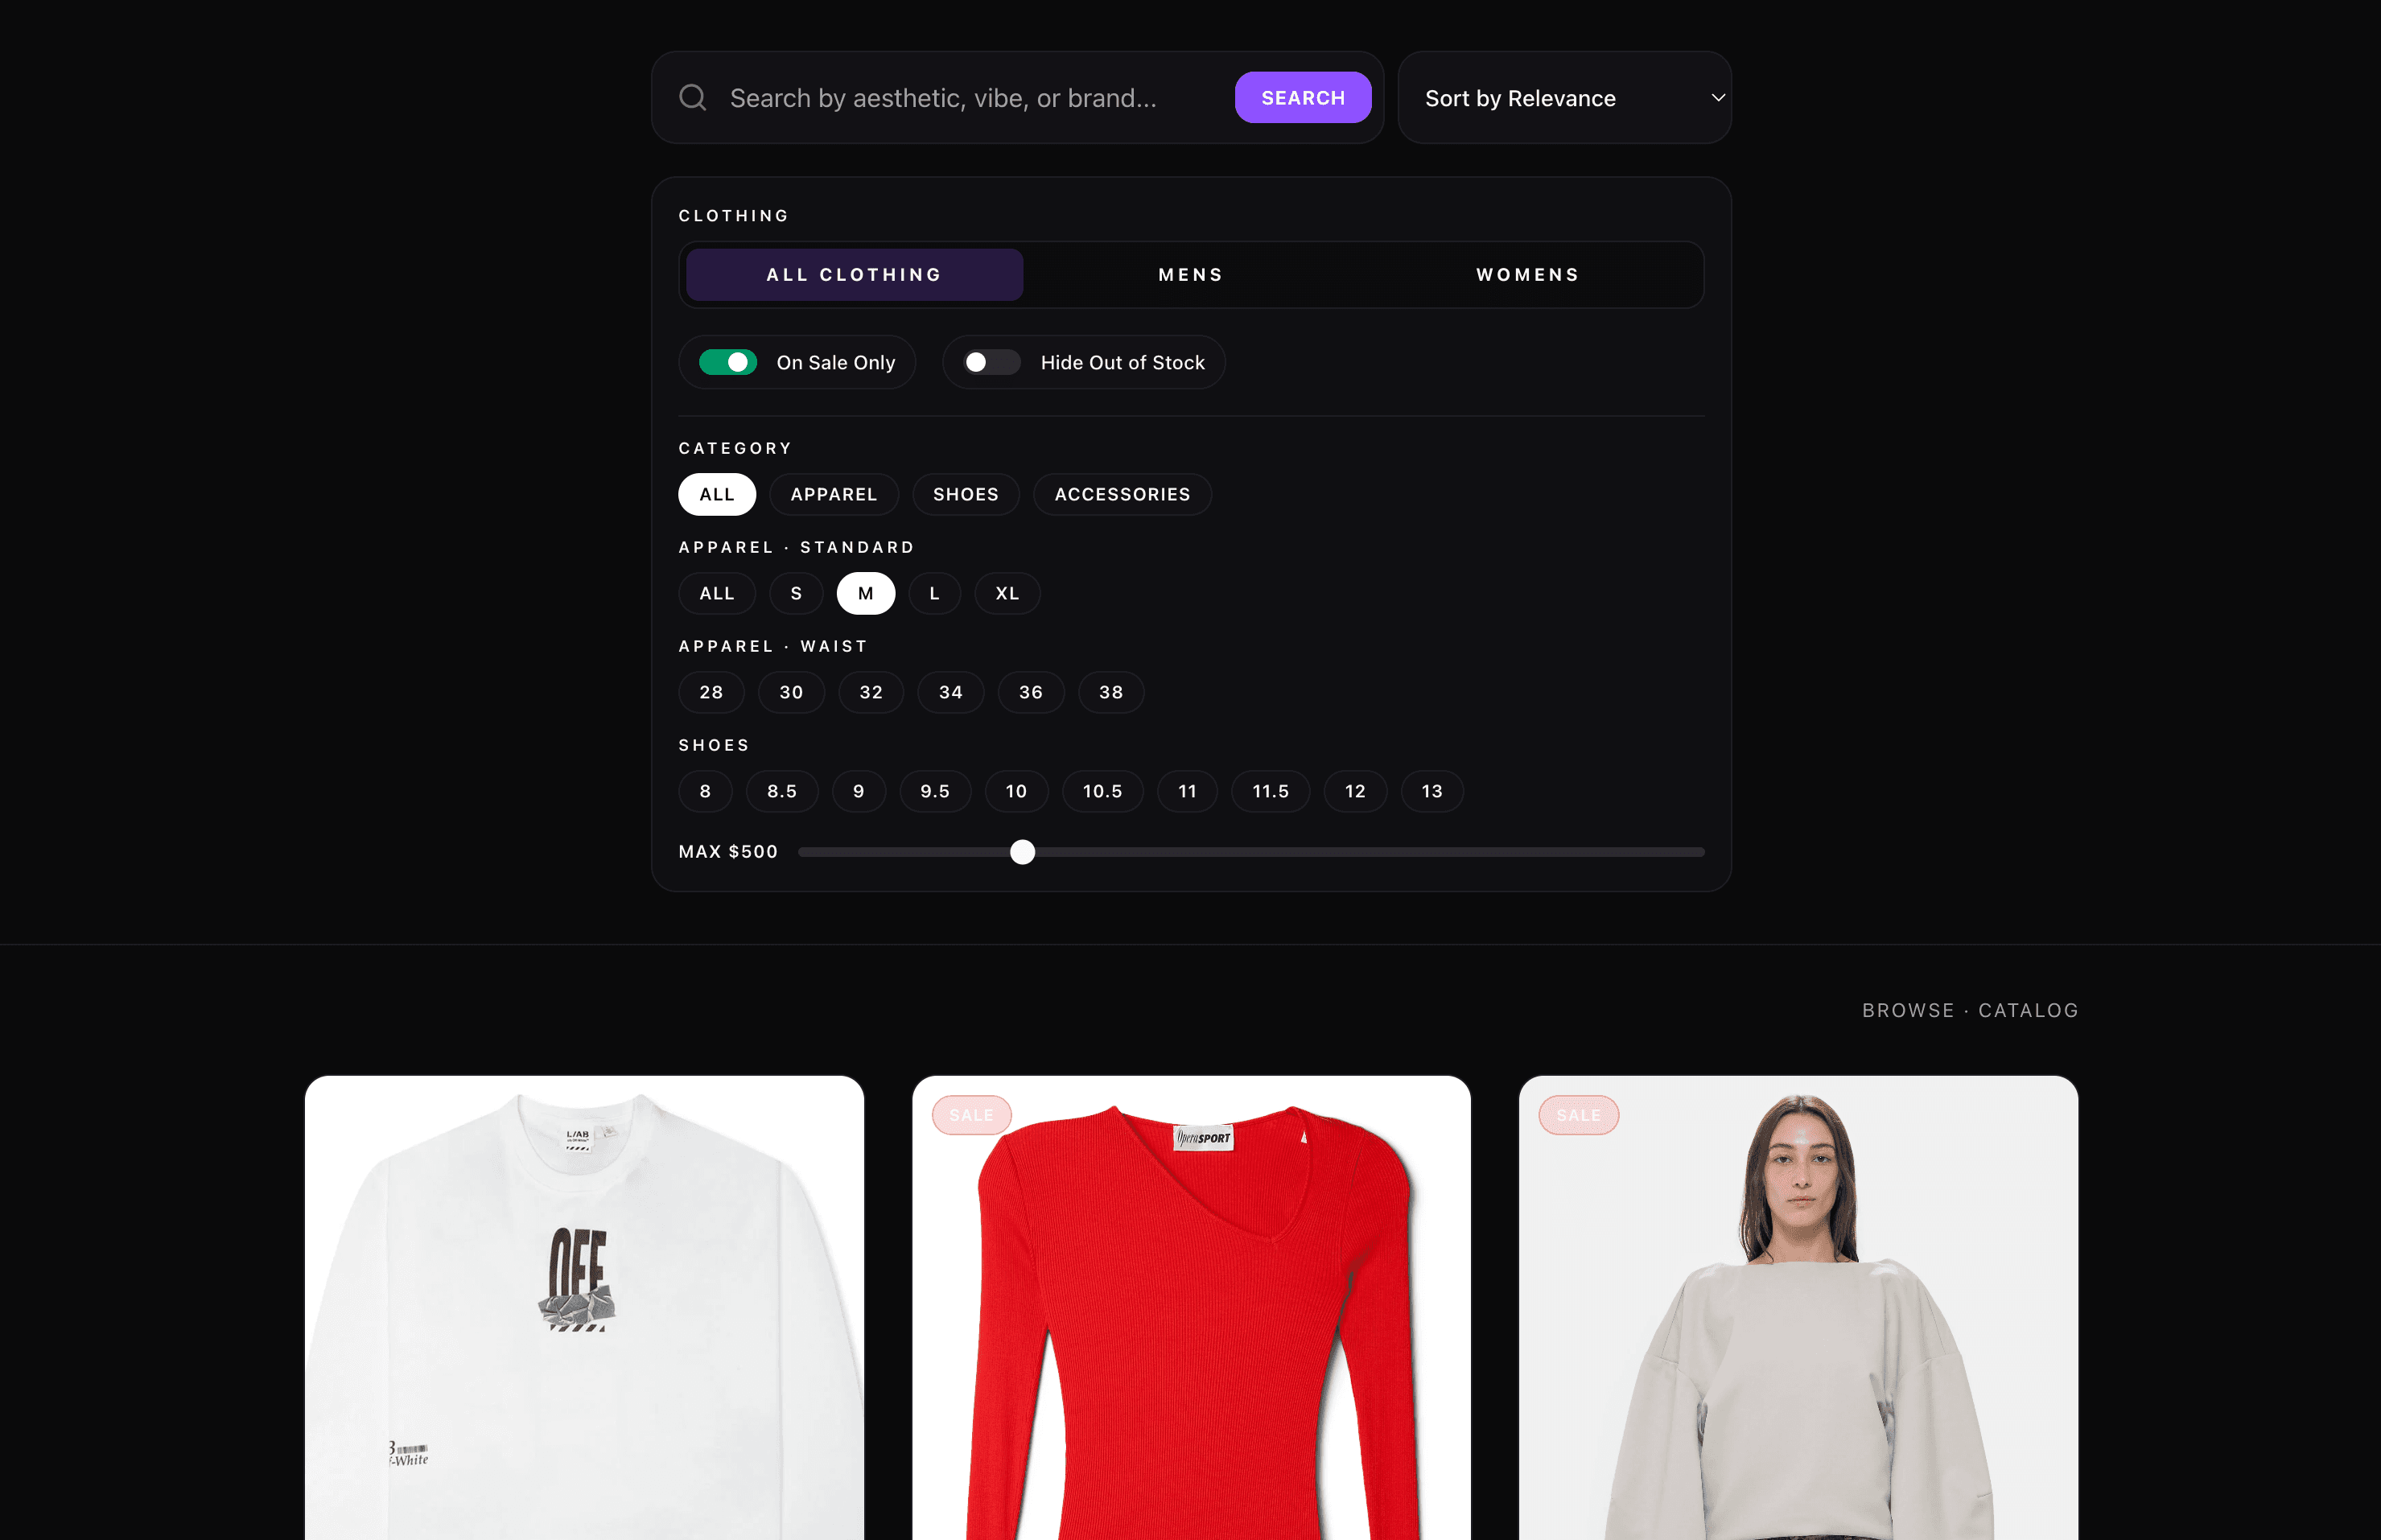
Early Turbo Fashion Index began as a fashion-discovery product, before the project became financial research.
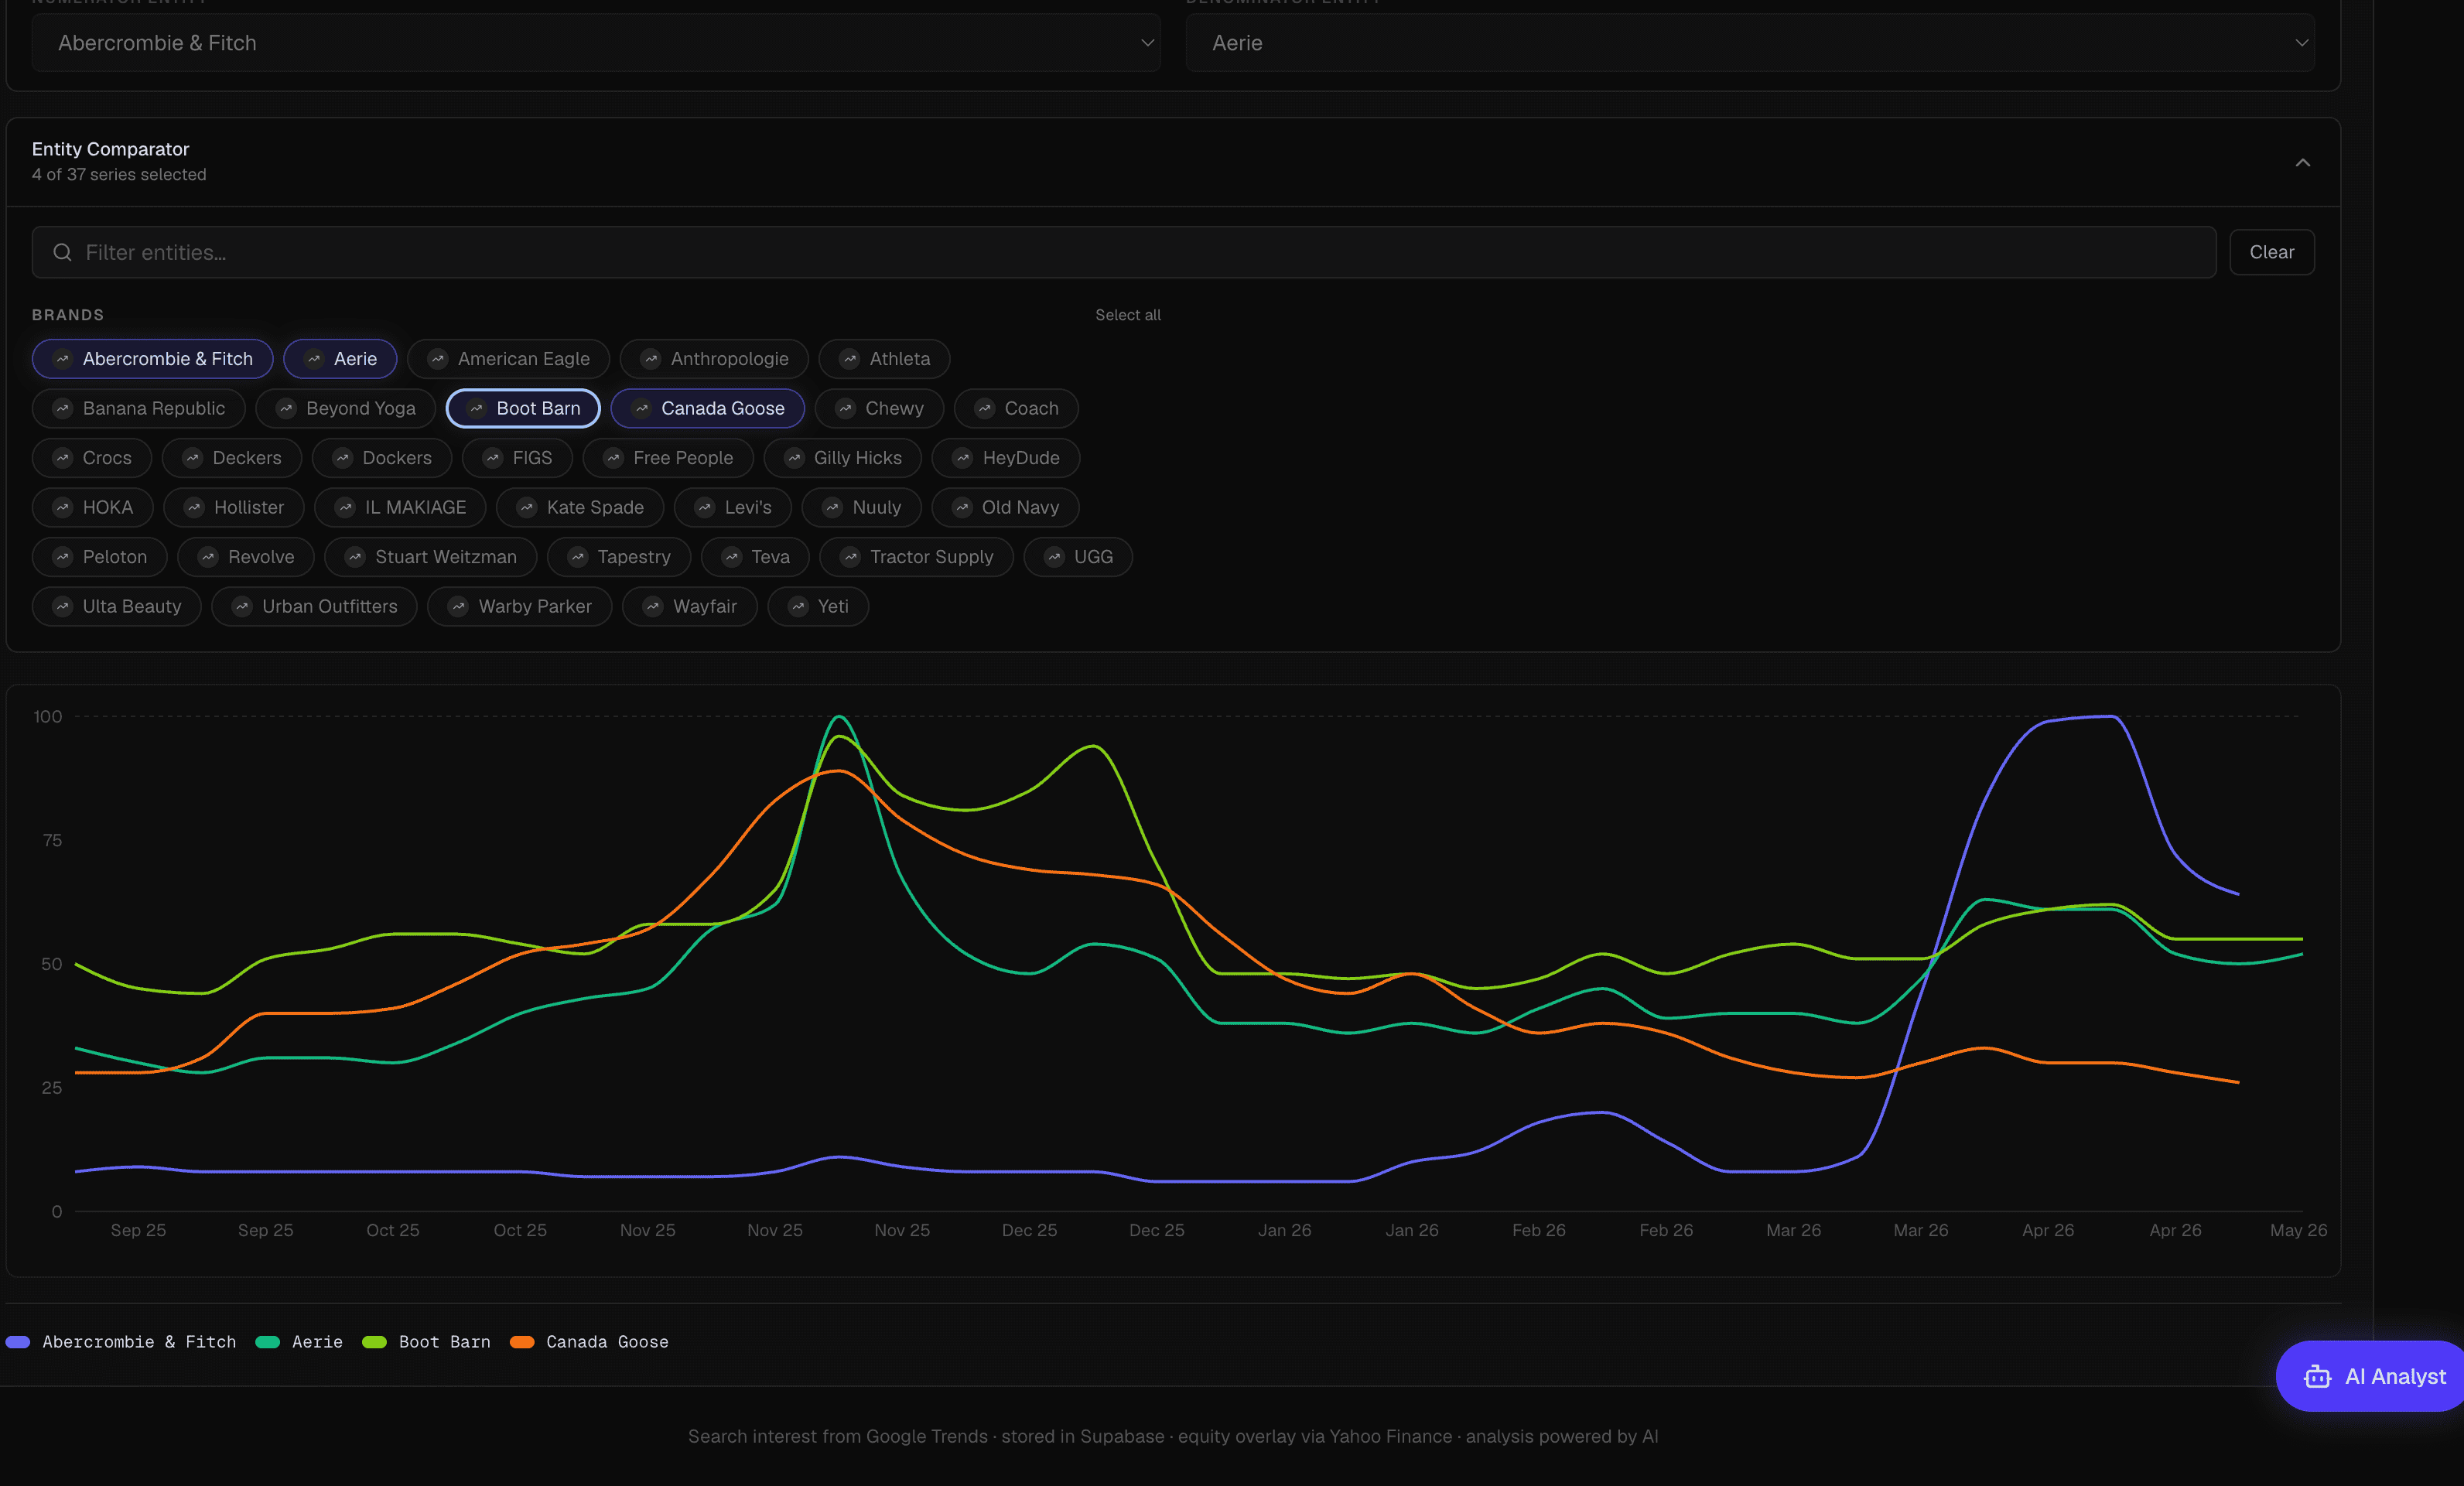
An early TFI interface comparing search-interest patterns across brands as the project moved toward alternative-data research.
Google Trends does not give a raw count of searches. It normalizes interest within the selected query, geography, and time period, with the highest relative point represented as 100. This made the data useful for tracking changes in attention, but it also created problems.
Seasonality was an obvious one. The North Face should naturally receive more attention during winter than summer. A direct comparison between December and July could therefore make ordinary seasonal behavior look like growth. I began using year-over-year changes instead, comparing a period with the same period one year earlier. The hope was that this would better separate growing brand momentum from normal seasonal patterns.
Ownership created another problem. A culturally important brand could represent only a small part of a much larger public company. Supreme search interest, for example, could not reasonably stand in for every part of a parent company with multiple brands. The model therefore began grouping child brands under their public parents and combining the underlying search information.
These changes made the comparisons more reasonable, but the output was still mostly a collection of interesting charts. I increasingly wanted to know whether the relationships had any useful predictive value.
That pushed the project from correlation toward a trading simulation.
The basic strategy was straightforward. When a brand showed unusually strong year-over-year search growth and passed several filters, a simulated portfolio would buy the parent stock, hold it for approximately one quarter, and then sell. The holding period was intended to capture the next earnings cycle, when stronger demand might begin appearing in reported financial performance.
An unreproduced handwritten meeting-preparation sheet from this period records one early four-year simulation with 54 highly filtered trades, a 59.3% win rate, a 129% total return, and an S&P 500 return of approximately 80.6%. At the time, I interpreted that as roughly 48 percentage points of market outperformance.
I need to be clear about what that number is and is not. It is evidence of the result I had calculated, written down, and was preparing to discuss at the time. I cannot reproduce that exact run from the surviving raw simulator files today, so I do not treat the apparent 129% return as a validated backtest result.
To write this paper, I later reconstructed the project’s history from Git commits, research logs, screenshots, old outputs, and files that could still be recovered from earlier points in Git history. I refer to this process as the repository reconstruction. It recovered later V5 and V6 simulator files but did not recover labeled V1–V4 numeric artifacts.
None of those qualifications were how I reacted at the time. I saw 129%, believed I had found something important, and very quickly started imagining what the system could become.
3. When the Model Stopped Working
The first serious warning came after what I remember as a relatively small change to the simulator.
I believe I changed how long the system held each stock, although I cannot confidently reconstruct the exact setting now. The outcome changed far more than I thought such a small modification should have caused.
At first, I assumed the newer model was broken.
I reran it. Then I reran the original model that I believed had produced the successful result.
I remember sitting at the same desk where I am writing this paper now. When the supposedly successful model no longer gave me the result I expected, my heart dropped. Until then, I had thought I was fixing a technical problem. Suddenly I was questioning the result that had made me so optimistic in the first place.
Looking back, I think I accepted that early number so quickly because of a combination of inexperience and wishful thinking. Search affecting consumer demand made intuitive sense to me, so a profitable investment strategy based on search felt believable. I did not yet have the instinct that a result that looks unusually good should usually receive more scrutiny rather than less.
The later simulator files recovered from the repository tell a much less impressive story.
Table 1. Recovered TFI Portfolio Simulations
| Simulator | Strategy | S&P 500 | Relative | Win rate | Trades |
|---|---|---|---|---|---|
| V5 | 51.62% | 78.81% | -27.19 pp | 43.33% | 30 |
| V6 | 65.12% | 79.45% | -14.34 pp | 47.73% | 81 |
Absolute gains do not imply market outperformance. Both recovered strategies earned positive absolute returns but underperformed the S&P 500 benchmark. Source: recovered repository result.
Both recovered strategies earned positive absolute returns but underperformed the S&P 500. V5 relative performance −27.19 percentage points (win rate 43.33%, 30 trades). V6 relative performance −14.34 percentage points (win rate 47.73%, 81 trades). Source: recovered repository result — simulator_trades.csv / simulator_v6_trades.csv at git cd08921^.
Both strategies made money over the periods represented in the recovered files. Both also materially underperformed simply holding the S&P 500.
This was my first real experience with overfitting rather than simply reading the definition.
Every modeling choice gave me another way to accidentally find a result that happened to work in the history I had already observed: the company universe, holding period, filters, correlation thresholds, search transformation, and timing rules. If I kept modifying those choices after seeing the results, I could end up optimizing the model to the past instead of discovering something likely to survive the future.
There was another issue I did not understand nearly well enough at first: multiple comparisons. If I tested enough companies, models, time periods, filters, and parameter combinations, some were likely to look unusually successful just through chance even if there was no stable underlying edge. The more things I tried, the more skeptical I needed to become about the best-looking result.
I also learned that making money in a historical simulation does not mean a strategy added value. If the strategy returned 60% during a period when the broad market returned 80%, the relevant result was not simply “+60%.”
These sound like basic ideas now. At the beginning of the project, they were not basic to me.
4. Outside Skepticism
Around this period, I began reaching out to people who understood economics and finance much better than I did.
One of those conversations was with Erwan Quintin. As I remember the meeting, he was one of the first people to respond to my results with real skepticism instead of focusing on how impressive the headline return looked. He asked about the strategy’s beta—essentially how much market risk the portfolio was taking—and encouraged me to run more tests and understand the system more deeply.
I am describing that conversation from my recollection rather than a transcript. Quintin did not supervise this research, review this paper, or endorse the final project.
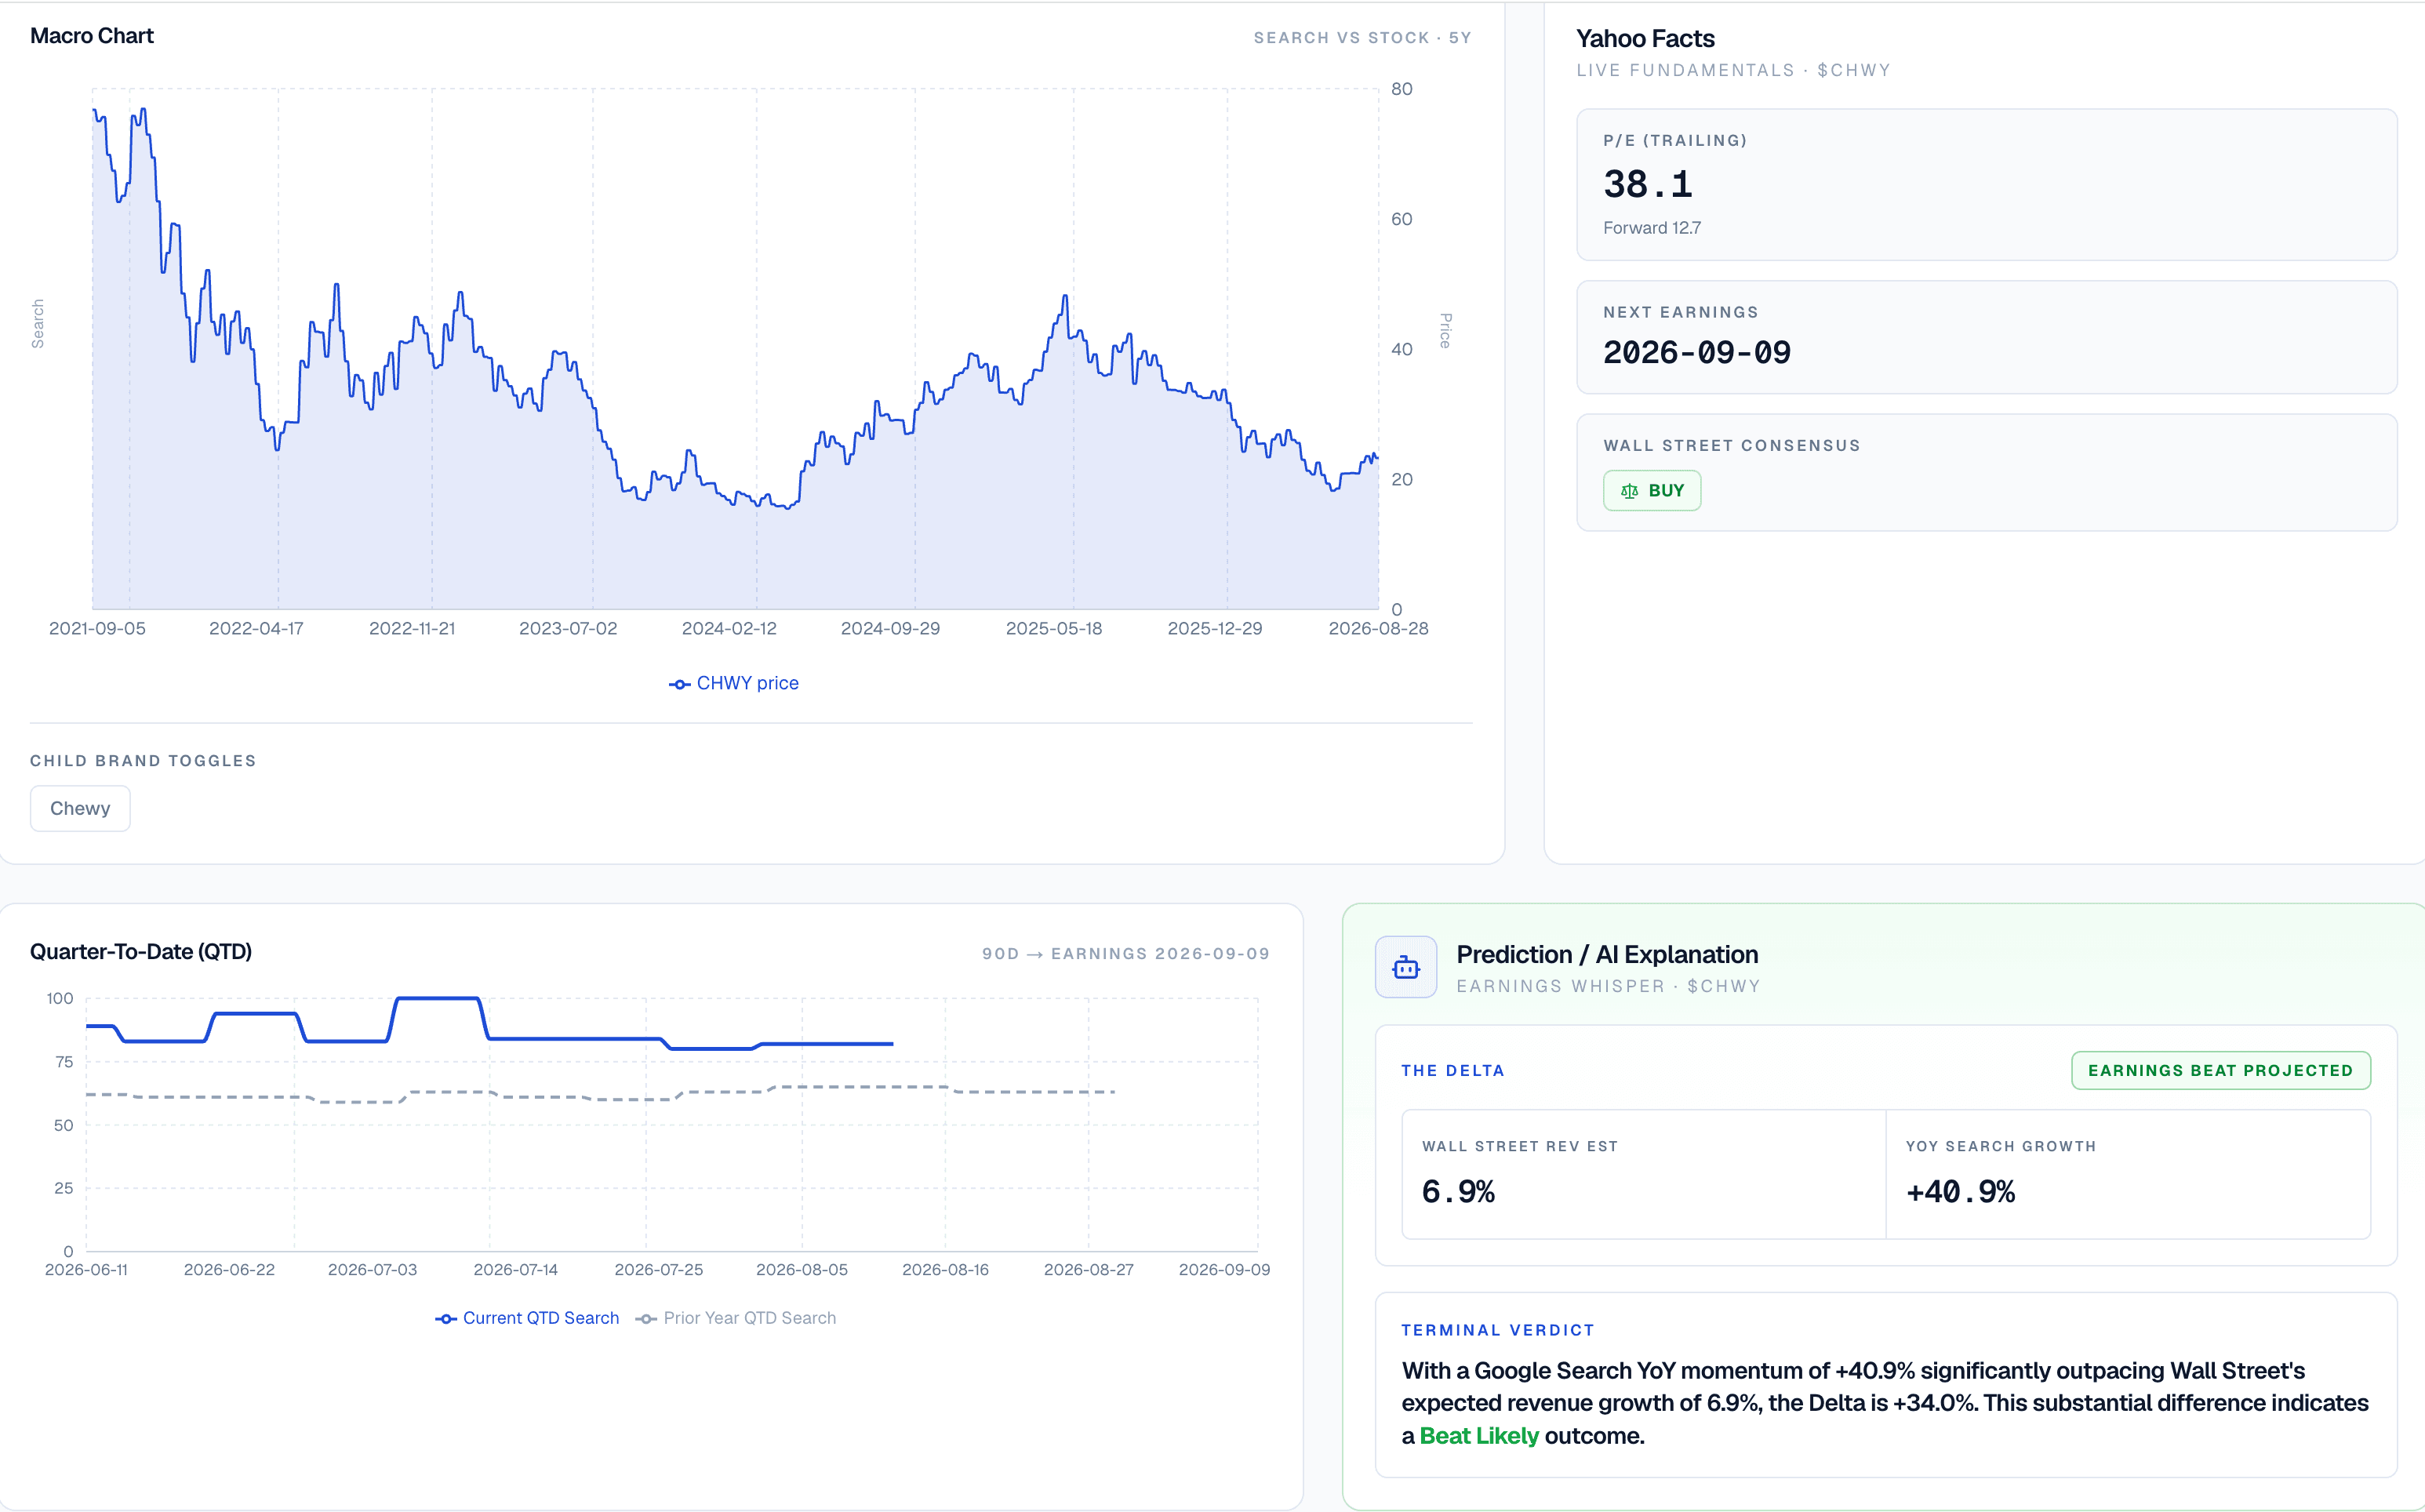
A historical interface showing how confidently the early system presented its conclusions (including language such as “Earnings Beat Projected” / “Beat Likely”). It is not evidence that those predictions were subsequently validated.
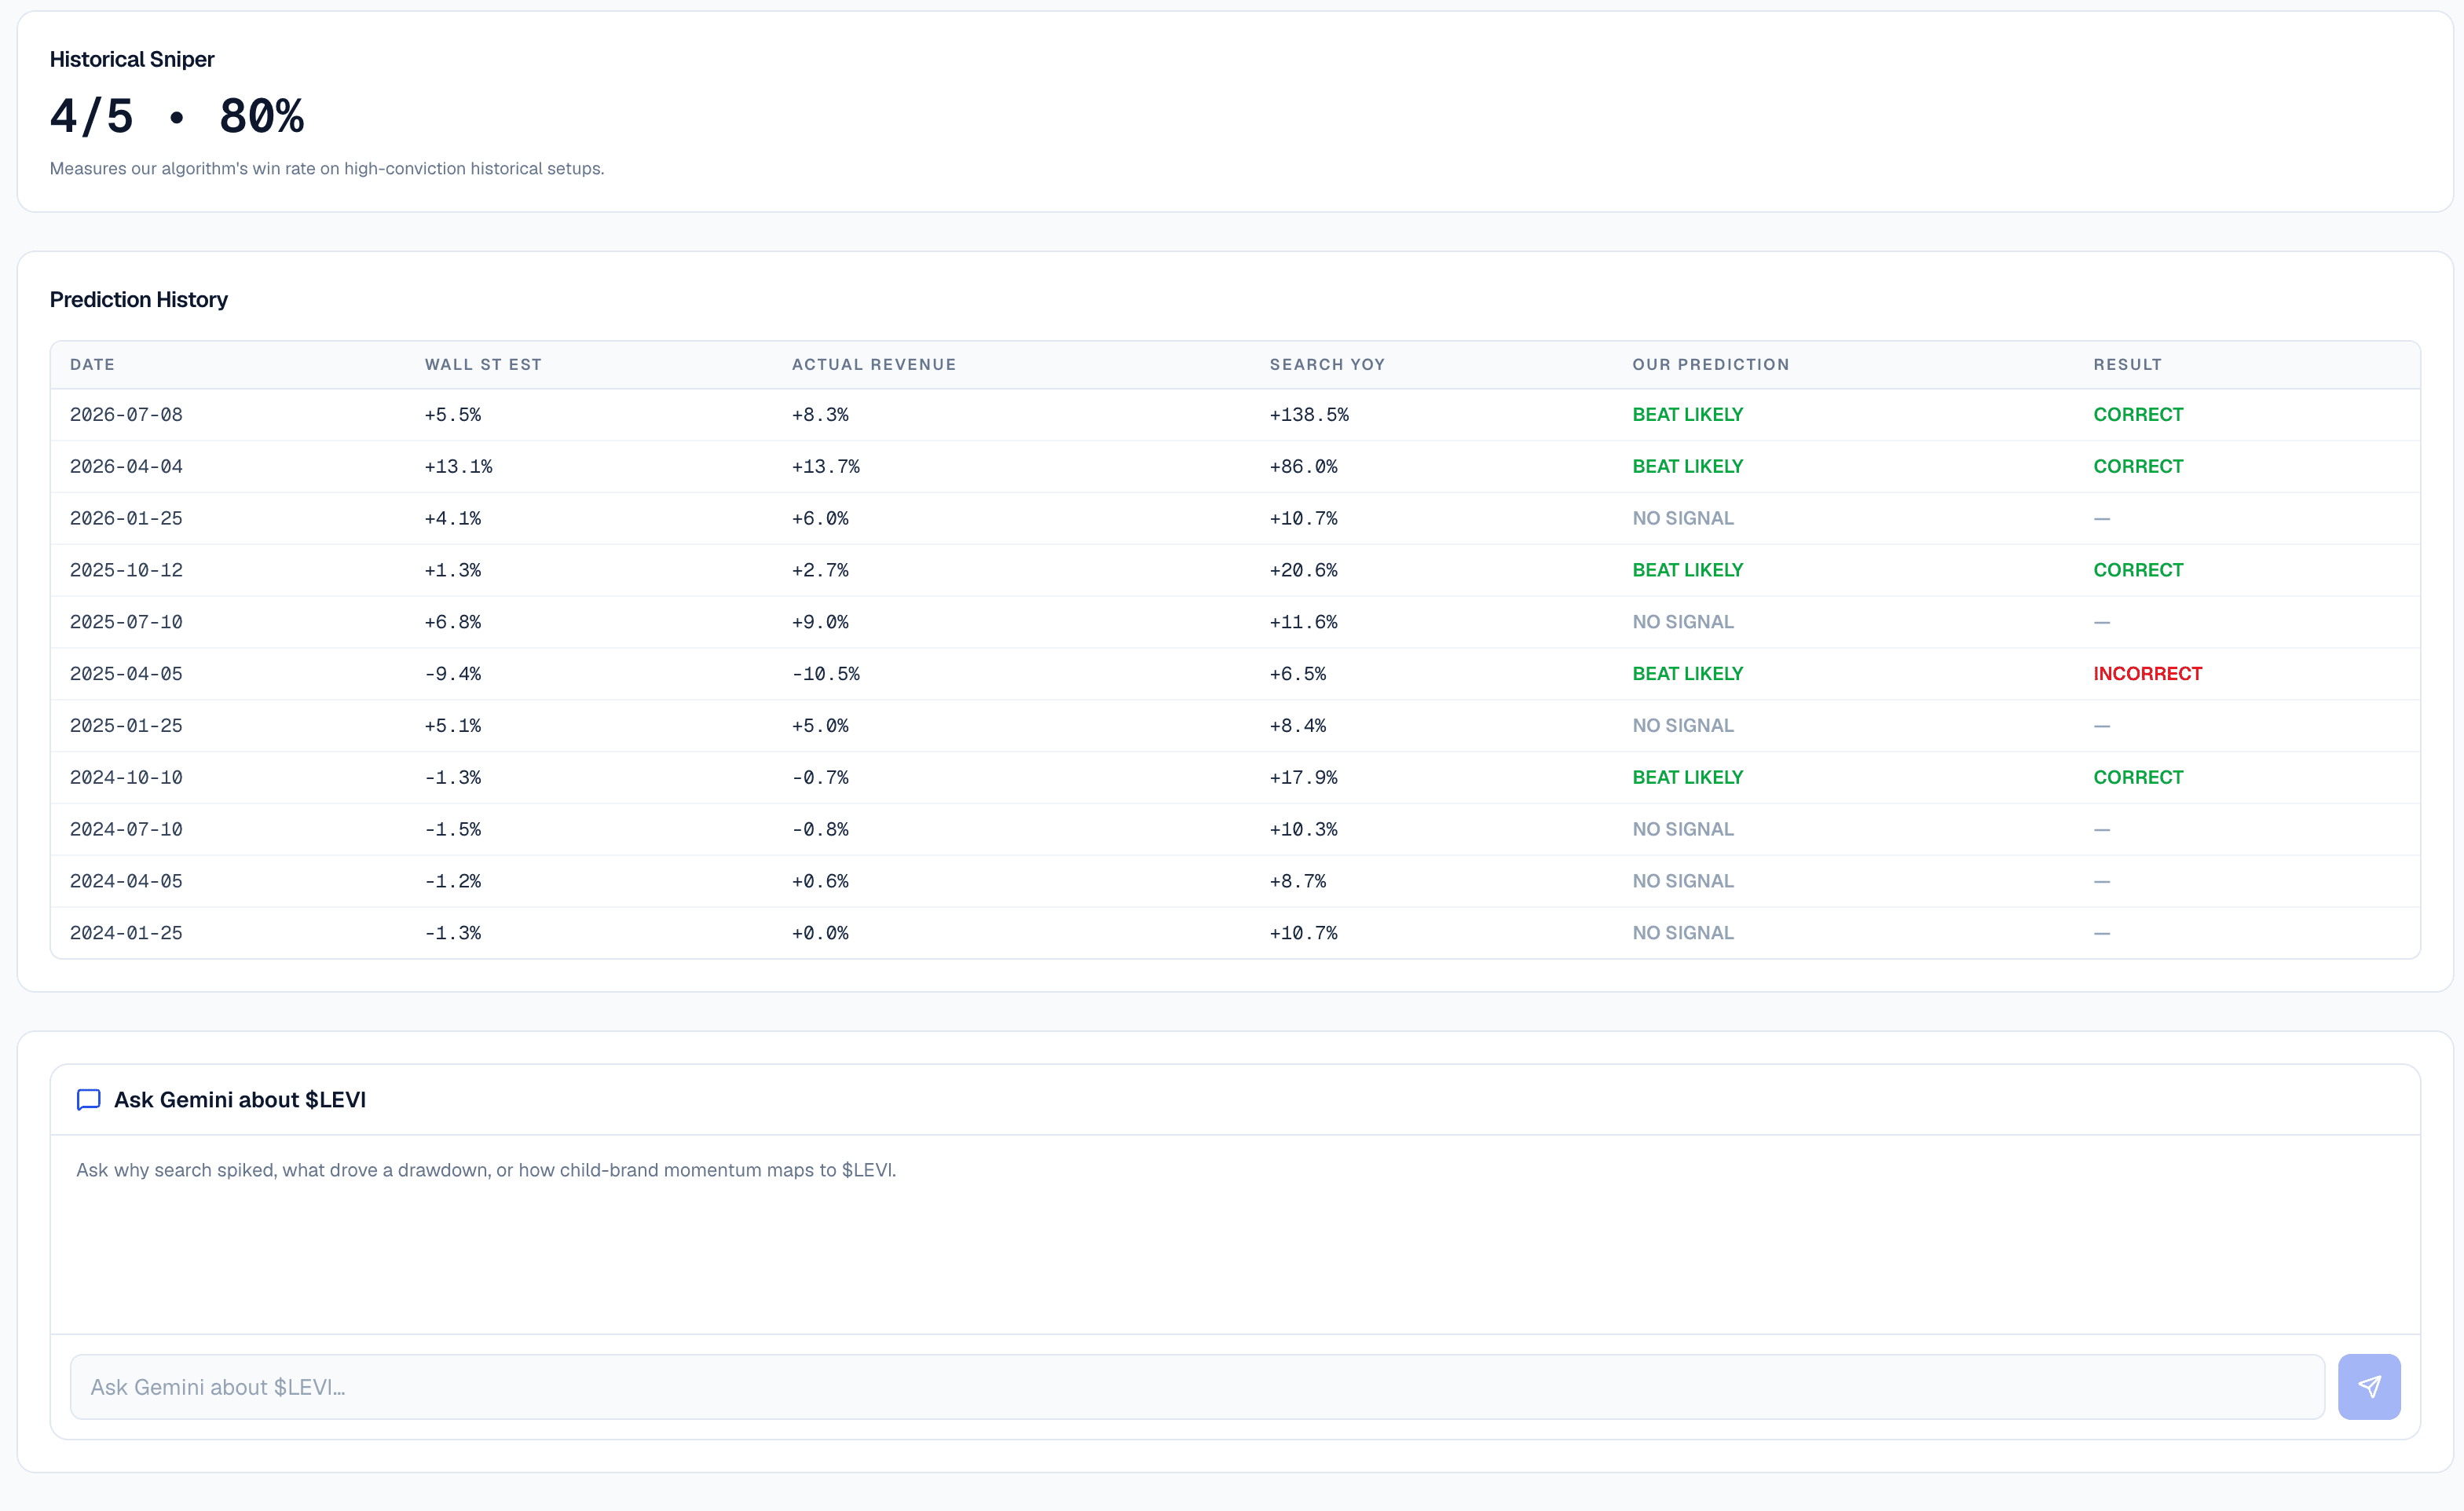
Documents the old Historical Sniper / prediction-history product presentation. It does not independently validate the displayed accuracy statistic.
The value of the conversation was not that it gave me a missing formula. It changed some of the questions I was asking.
I had been focused on whether my result looked good. I needed to start asking whether I had taken more risk to achieve it, whether it survived different assumptions, whether I would actually have possessed the necessary information at the time, and whether there was a real economic reason the relationship should exist.
I also had other conversations during this period about investing and entrepreneurship. I do not treat those conversations as evidence for the research itself, but speaking with people who had far more experience than I did helped show me how much I still did not understand.
That became increasingly obvious as the project moved away from stock-price prediction.
5. From Stock Prices to Earnings
My original logic had roughly four stages:
search attention → consumer demand → company earnings → stock price
The more I learned, the less comfortable I became with the final step.
Even if I could identify something useful about demand, stock prices depended on much more than current business performance. Investor expectations, valuation, macroeconomic conditions, management commentary, industry news, and countless other factors could affect how the stock reacted.
A company could perform well and fall because the market expected even better results.
I decided to simplify the target. Instead of trying to predict the stock, I focused on quarterly business performance, particularly revenue. Search activity was at least conceptually closer to customer demand than to short-term stock returns.
The company universe also expanded beyond fashion. Over the course of the research, I tested companies including ONON, HIMS, DUOL, CAVA, PLNT, ETSY, NVDA and several additional consumer-facing businesses.
At the same time, I tried to improve the search data itself.
Google Trends’ relative normalization made historical collection awkward. Later experiments used DataForSEO search-volume data, which gave me more control over the underlying measurements. This was not one clean switch: the repository shows Google Trends remaining in the older TFI research while DataForSEO was used for later ONON, ELF, and LOVE experiments.
I hoped better data would make the search relationship clearer.
It did not.
For ONON, one simple financial baseline produced a walk-forward mean absolute error (MAE) of 9.35 percentage points across 13 observations. Here, MAE means the average size of the model’s error in predicting year-over-year revenue growth. A walk-forward test means earlier periods were used to build or calibrate the model before testing it on later periods rather than allowing future information into the past.
No search-enhanced model beat both financial baselines, and adding search in the same-quarter nowcast actually worsened error relative to the baseline.
The result did not prove search attention was meaningless. It meant that in the companies and periods I tested, I had not shown that search added enough information beyond simple financial history to justify treating it as a forecasting edge.
I still find the original hype question interesting. If I returned to it today, I would probably focus on one or a few primarily online, direct-to-consumer businesses and ask whether search activity helps explain a specific operating metric rather than immediately trying to turn one general relationship into a trading strategy.
As the project moved away from fashion-specific search signals and toward earnings expectations and business drivers, I renamed it Quarter Winner.
6. Moving Closer to the Business: KPIs
The next direction was to stop looking only at general attention and focus more directly on how each business actually produces revenue.
Different companies have different operating drivers.
For a marketplace, revenue may be closely related to gross merchandise volume and the percentage of that volume the platform keeps. A subscription business may depend on subscribers and monetization per subscriber. An advertising company may depend heavily on users and revenue per user. A restaurant business may depend on unit count, sales per location, and same-store growth.
These measures are often called key performance indicators, or KPIs.
A large retrospective KPI test initially looked very strong. Single-KPI observations produced 80.96% directional alignment across 184 observations, using an accuracy calculation that gave each company equal weight. Multi-KPI observations produced 90.83% directional alignment across 32 observations.
These are different tests and information sets, not directly comparable forecasting systems. The first two use earnings-day KPI actuals and partly reflect mechanical operating relationships; the third uses information eligible before earnings. They are not a single forecasting accuracy series. Single-KPI 80.96% (n=184); multi-KPI 90.83% (n=32); pre-earnings management-guidance direction 20.37% (n=37). Source: historical branch artifact — git commit f683c86 research/kpi-predictive-tests/REPORT.md.
Those percentages need two major qualifications.
First, these were oracle tests. They used KPI results reported on earnings day. They therefore tested whether a known KPI surprise moved in the same direction as a known revenue surprise, not whether I could forecast that KPI before earnings.
Second, some of the relationship is close to mechanical.
If marketplace revenue is approximately:
Revenue ≈ Gross Merchandise Volume × Take Rate
then a large surprise in gross merchandise volume should often line up with a revenue surprise when take rate is reasonably stable. Likewise, if a subscription company’s revenue depends heavily on subscribers and monetization, knowing the subscriber result after the quarter has ended is already knowing part of the arithmetic that produced revenue.
So the 80.96% and 90.83% figures were not evidence that I had discovered a hidden Wall Street signal. They were better understood as evidence that the selected KPIs captured meaningful pieces of how those businesses generated revenue.
That still interested me.
By then, I had become more skeptical than I was during the early TFI tests. I knew that finding a variable related to earnings was completely different from being able to know that variable before everyone else.
The stricter pre-earnings results made that difference obvious.
Using management guidance that was genuinely eligible before earnings, directional accuracy was only 20.37% across 37 observations. A guidance model showed a 16.09% improvement in one leave-one-company-out test—where one company is held back while the model is evaluated using information from the others—but the advantage disappeared in a later time-based holdout. The time holdout improvement was -0.14% across 12 observations.
The practical problem was straightforward: the best operating information usually is not available throughout the quarter.
Companies may provide guidance or occasional updates, but most important KPIs are not continuously disclosed. When genuinely important public information does appear, analysts can also react to it. Definitions may change between quarters. Some information is available only through expensive data providers. And each business requires different logic.
Trying to make one automated system handle all of them made the problem worse. The more general I tried to make Quarter Winner, the easier it became to lose the company-specific detail that made the KPI work useful in the first place.
The KPI experiments gave me something more modest than the forecasting edge I had originally wanted. They made the structure of the businesses much clearer to me.
7. Testing Quarter Winner Against Wall Street
Once Quarter Winner was being built around company-specific business drivers, I needed a stronger benchmark.
It was not enough to outperform a naïve forecast based only on last year’s growth. If I wanted to claim QW had information value around earnings, it needed to be tested against the expectations professional analysts were already producing.
The strict August research sprint compared QW revenue estimates against available Street estimates using mean absolute percentage error (MAPE). MAPE measures the average absolute forecast error as a percentage of the actual reported result: lower is better.
Table 2. Strict Quarter Winner vs. Street Comparisons
| Company | n | QW MAPE | Street MAPE | Result |
|---|---|---|---|---|
| NVDA | 9 | 14.23% | 3.99% | Street substantially better |
| DUOL | 8 | 1.93% | 2.35% | QW better on raw MAPE |
| CAVA | 5 | 2.77% | 2.27% | Street better |
| PLNT | 5 | 6.53% | 4.61% | Street better |
| ETSY | 7 | 2.28% | 1.85% | Street better |
These company samples are small and diagnostic. They should not be interpreted as precise estimates of future performance. Controlling sprint memo: QW beat raw Street MAPE in 1 of 5 completed tests (DUOL only); that result did not cleanly survive bias-null attribution. Source: research/outputs/qw_edge_discovery_decision_2026-08-10.md.
Across the five completed comparisons, Quarter Winner produced the lower raw MAPE only once, for DUOL. The project’s controlling research memo classified the overall result as RED.
These are very small samples—only five to nine historical observations for each company—so the results should be treated as diagnostic evidence rather than precise estimates of how either approach would perform in the future. But they were enough to make it clear that I had not demonstrated a broad, reliable advantage over Street.
Even DUOL became less convincing under a simpler test.
A null model is a deliberately simple baseline used to ask whether a complicated model actually contributes anything. In a follow-up DUOL comparison, a null based on persistence in the previous earnings surprise achieved about 1.19% MAPE, compared with approximately 1.91% for QW.
That meant the one apparent QW win against Street still did not establish that Quarter Winner’s more complicated business analysis was responsible.
Other promising effects weakened in similar ways. For example, a tiny exploratory lower-analyst-coverage sample of SG and VITL showed a 45.6% improvement from a persistence adjustment across only six observations. But when the same idea was examined in a broader new-company panel of 68 observations, the improvement became -2.4%.
For a long time, every failed test simply caused me to look for the next direction. Eventually I realized I was pivoting so quickly that I was not giving the failures enough time to change how I thought.
I had learned much more about earnings and how businesses worked, but I still had no concrete reason to believe I knew something that Wall Street systematically did not.
I decided it made more sense to slow down and keep learning than to keep trying to force an edge into existence.
8. What Street Needs
One idea from the Quarter Winner phase remained useful even after the forecasting claim weakened: What Street Needs, or WSN.
WSN developed while I was building company-specific earnings models. It was part of the machinery I hoped might eventually help forecasting, but its usefulness did not depend on proving that QW could beat Street.
Wall Street revenue expectations are normally presented as headline numbers. If analysts expect a company to report $800 million of revenue, the number tells you the endpoint. It does not automatically tell you what operating performance would have to occur inside the company to produce that result.
WSN works backward.
For a marketplace:
Revenue ≈ GMS × Take Rate
For a subscription company:
Revenue ≈ Subscribers × Monetization per Subscriber
For an advertising company:
Revenue ≈ Users × Revenue per User
These are simplified operating identities rather than complete accounting models, but they allow a revenue expectation to be translated into the business variables that matter.
ETSY is one example. Quarter Winner’s final Q3 2026 research uses a revenue expectation of approximately $667.2 million and analyzes the business primarily through gross merchandise sales, or GMS, and take rate.
Rather than only displaying $667.2 million, WSN asks:
What level of GMS would Etsy need, given the take-rate assumption, to produce approximately $667.2 million of revenue?
The basic rearrangement is:
Required GMS = Expected Revenue ÷ Expected Take Rate
Required GMS = Expected Revenue ÷ Expected Take Rate
Using the same inputs as the published Quarter Winner ETSY page for 2026Q3:
- Expected revenue (Street)
- $667.2M — Zacks consensus (manual verified observation)
- Expected take rate
- 26% — target-quarter management take-rate outlook (~issuer approximate)
- Implied required GMS
- $2,566.2M — $667.2 ÷ (26/100)
For reference, at the last reported take rate (25.9%), the same Street revenue implies required GMS ≈ $2,579M. The published page highlights the management take-rate scenario. Source: research/outputs/_v3_eval/evaluations_2026-08-24.json and lib/qw/intelligence/what-street-needs/etsy-identity.ts.
That implied operating requirement can then be compared with Etsy’s recent GMS, management’s outlook, and other current evidence.
The point is not that this calculation predicts whether Etsy will beat earnings. It tells the reader what the revenue expectation is actually asking the business to accomplish. If the required operating performance is far ahead of what the company has recently been producing, that is worth investigating. If it is consistent with current guidance and trends, that tells a different story.
This is the version of Quarter Winner I ultimately felt comfortable publishing.
Instead of claiming that a company will beat Wall Street, it breaks down what the expectation implies and shows the evidence surrounding it.

Published Quarter Winner research page for ETSY, showing operating translation of a Street revenue expectation (What Street Needs).
The final public release is deliberately limited to ETSY, HIMS, DUOL, and RDDT rather than pretending the same automated system can produce equally strong analysis for any ticker. That smaller release is consistent with what the research taught me about the importance of company-specific work.
Quarter Winner became more useful to me once I stopped requiring it to be a prediction machine.
9. What I Would Do Differently
If I restarted Turbo Fashion Index today, what I would change depends on what I wanted the project to be.
If I were trying to build a business, I would spend far more time before development figuring out whether anybody actually wanted it, where it fit into the market, and what users needed. I went too quickly from having an idea to building as much of it as I could.
If I were restarting the research, I would almost do the opposite of what I did the first time. I would work with fewer companies, automate less at the beginning, and understand each business more deeply. I would decide exactly what question I wanted to answer before building the infrastructure around it.
I would also document everything much more carefully.
The repository reconstruction for this paper made that painfully obvious. Some results I remembered could not be recovered in reproducible form. The apparent early market-beating run survives as a meeting-preparation sheet, while V1–V4 simulator artifacts were not found. Several other remembered numbers turned out to belong to different tests than I initially thought.
If I did this again, every major model would have a saved version, exact input data, assumptions, date, result, and short explanation of what I thought it meant at the time.
I would also use AI differently.
AI made this project possible at a scale I could not have reached alone. It helped me write the website, organize data, build collectors, debug code, and process thousands of observations. Tasks that could have taken me weeks could sometimes be completed in hours.
But after enough failures, I began relying on AI for more than execution. I increasingly used it to suggest where the project should go next because I wanted to keep the ball moving.
That created a problem. I could produce new systems faster than I could fully understand them.
Every once in a while I would look at what I had built and feel like I was staring at a mess of wires that I now had to untangle. I had made progress technically, but I had sometimes skipped part of the learning that was supposed to be the point of the project.
I would still use AI heavily if I restarted. But I would try to keep the research question, interpretation, and decisions about when to pivot much more firmly in my own hands.
My standard for exciting results has changed too. I now want to know whether the underlying data are legitimate, whether the model beats a simple baseline, whether the result survives another period or company, whether the information was actually available at the time, and whether there is a reasonable economic explanation for the relationship.
If something looks almost too good to be true, I now know that is when I should probably spend the most time trying to prove myself wrong.
10. Limitations
This project has substantial limitations and should not be interpreted as evidence of a profitable trading strategy.
The company samples were often small and non-random. Models, company sets, filters, and research questions also changed over the course of the project. Exploring many alternatives after seeing earlier results creates substantial opportunity for overfitting.
There is also a multiple-comparisons problem. Across many models, companies, parameters, and time periods, some combinations can look successful purely by chance. This is especially dangerous when the researcher sees each result and then decides what to test next, as I often did during the earlier stages of this project.
Historical point-in-time (PIT) quality was also inconsistent. Point-in-time data means information that genuinely could have been available before the outcome being predicted. Some later QW systems were specifically designed around dated evidence and pre-earnings freezes, but earlier alternative-data experiments did not consistently meet that standard. The repository reconstruction identifies the DataForSEO research as not fully PIT-safe.
KPI definitions and reporting practices vary greatly across companies, which limits how well one general methodology can transfer between business models.
The strongest KPI-direction results used earnings-day actuals and should therefore be interpreted as retrospective operating relationships rather than forecast accuracy. Some of the observed KPI/revenue alignment also follows naturally from the accounting or operating relationships connecting those variables.
Several apparent findings weakened when tested against new companies, later periods, or simpler alternatives. The lower-coverage hypothesis did not generalize cleanly, and the apparent DUOL advantage over Street failed against a simpler persistence null.
Finally, Quarter Winner does not have a large completed prospective track record. Some predictions or research states were frozen before earnings, but the repository reconstruction did not recover completed outcomes for several prospective locks.
For me, the biggest limitation was probably broader than any one technical issue: I repeatedly moved too quickly from a promising result to the next stage of development. The project covered a lot of ground, but that did not always mean the research was as careful as it could have been.
11. Conclusion
Quarter Winner did not prove that online search could reliably beat the stock market. Search did not add robust forecasting value over simple financial baselines in the tests I completed. The KPI research showed that business-specific operating metrics can be closely related to revenue, but much of the strongest evidence used hindsight or relationships that were already partly built into how the businesses generate revenue. And when QW was tested directly against available Street estimates, the evidence did not establish a repeatable advantage.
Those are not the results I wanted when I started.
By the standards I originally set, Quarter Winner failed at a lot of things. It didn’t beat Wall Street, never made money, never became the automated research engine I imagined, and was never really tested as a serious business.
For how much time I put into it, it would be reasonable to wonder whether that effort was wasted.
I don’t think it was.
I understand earnings differently now. I know much more about how individual businesses make money and why the KPIs that matter for one company may be completely different from those that matter for another. I understand why a backtest needs a benchmark, why point-in-time information matters, and why a relationship that makes intuitive sense is not automatically something you can make money from.
What ended up mattering most to me was that I actually went through the process instead of only thinking about doing it.
I know what it feels like to believe a result and then watch it disappear. I know how easy it is to keep pivoting instead of admitting I do not yet have an answer. I know that building faster does not always mean learning faster. Those lessons are much more real to me now because I made the mistakes myself.
Quarter Winner started because I wanted to find an answer about hype and the stock market. I ended up with many more questions than I started with, but they are much better questions.
Whether someone finds the alternative-data research interesting, learns something from the earnings breakdowns, or simply sees how much changed between the first version of the project and the last, I hope there is something useful in the process itself.
I know I will keep finding questions I want answered and doing the work to see what the evidence actually says.
Sources and evidence notes
This page distinguishes contemporaneous historical artifacts, recovered repository outputs, company filings / IR sources, named Street observations, and founder recollection. Core recovered files:
- recovered repository outputEdge discovery decision memo (2026-08-10)
research/outputs/qw_edge_discovery_decision_2026-08-10.md - recovered repository outputEdge Map audit v0.1
research/outputs/qw_edge_map_audit_2026-08-10.md - recovered repository outputEdge Map v0.2
research/outputs/qw_edge_map_v02_2026-08-10.md - recovered repository outputLower-coverage Edge Map v0.3
research/outputs/qw_lower_coverage_edge_v03_2026-08-10.md - recovered repository outputNVDA QW vs Street backtest
research/outputs/nvda_qw_vs_street_backtest_summary_2026-08-10.md - recovered repository outputDUOL strict Street test
research/outputs/duol_qw_vs_street_strict_2026-08-10.md - recovered repository outputDUOL bias-null attribution
research/outputs/duol_edge_attribution_null_test_2026-08-10.md - recovered repository outputETSY strict Street test
research/outputs/etsy_qw_vs_street_strict_2026-08-10.md - recovered repository outputPLNT strict Street test
research/outputs/plnt_qw_vs_street_strict_2026-08-10.md - recovered repository outputCAVA strict Street test
research/outputs/cava_qw_vs_street_strict_2026-08-10.md - recovered repository outputONON baseline walk-forward
research/outputs/onon_baseline_walkforward_report_2026-08-09.md - recovered repository outputTFI → QW evidence archaeology
research/TFI_QW_EVIDENCE_ARCHAEOLOGY.md - historical branch artifactKPI predictive test battery (REPORT.md)
git:f683c86:research/kpi-predictive-tests/REPORT.md
KPI predictive-test numbers are documented from historical commit f683c86 on the phase-2 research branch; that tree is not rewritten here. Simulator percentages are recovered from deleted CSV artifacts at cd08921^ (see archaeology report).
Quarter Winner was built with AI-assisted development tools. AI was used for software development, data organization, source discovery, and presentation; research questions, interpretation, validation decisions, and the conclusions presented here remain the author's responsibility. AI-generated claims are not treated as source-of-truth evidence.